Case study: Eigenbrodt


Role:
UX and Service Designer on a team of 5. Working for 4 weeks with b2b Eigenbrodt, both remotely and at Hyper Island.
Tasks: UX, UI, User research, Prototyping
Deliverables
- User insights & interviews
- User Journeys
- Prototype in Figma
The problem
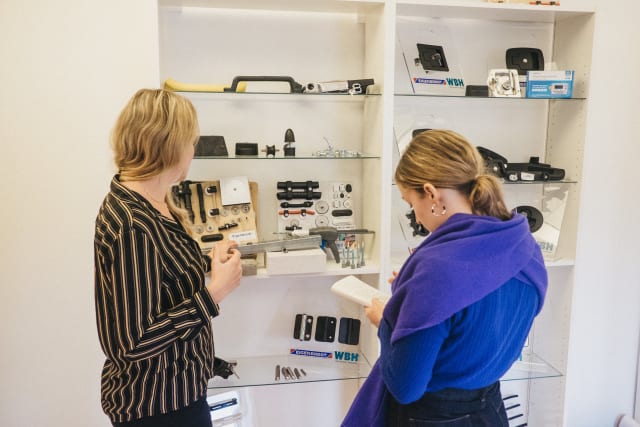
The brief given by Eigenbrodt (a premium reseller of mechanical parts based in Stockholm) was to "increase overall sales and support the sales staff to facilitate the interaction between clients and the sales team." Eigenbrodt teamed up Hyper Island and assigned a User Experience (UX) team to see how this could be possible.


Approach
I approached this brief with a holistic mindset, wanting to understand the core problem at hand before ideating solutions. Using the 5 stages of design thinking (pictured below) we divided the project into 4 phases; (1) Research, (2) Analysis (3) Ideation, (4) Prototype and (5)Test.
Our team worked closely with Eigenbrodt, interviewing and mapping user journeys for Eigenbrodt's customers, conducted qualitative and quantitative research, assessed future trends and weak signals, ideated based on Design Thinking techniques, conducted an ideation workshop with the client, created low and high fidelity prototypes based on wire-frames, then tested them on users.


Phase 1: Initial research
To gain a better overall understanding of Eigenbrodt's users (including their employees) I first looked at Secondary Research avenues, analysing several relevant reports such as Orvesto and materials online. These focused on; the target group's behaviours and motivations, their perceptions of the brand, how they react emotionally and physically and the role that similar brands play in their daily life.
We also researched future trends and weak signals to ensure the potential solution would address future needs and requirements. For this we used a PESTLE analysis and created cards categorised into the following indicators (Political, Economic, Social, Technological, Legal and Environmental/Ethical) to see that the research covered every sphere of influence.


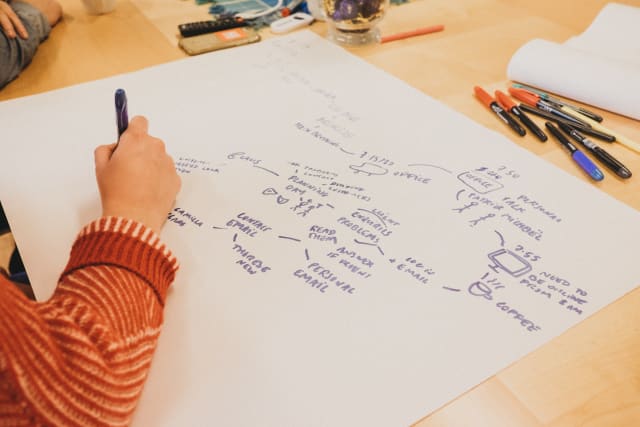
Phase 1: Interviews
Following on from the secondary research and our STEP analysis, we conducted two full days of customer and stakeholder interviews. The goal with these interviews was to map out customer and user journeys, actions, questions, gains, pains and to find potential opportunities. To do this, we individually mapped out user journeys focusing on their jobs-to-be-done and matched those to Eigenbrodt's value proposition (using the Value Proposition Canvas). Directly after these interviews, the team conducted debrief-meetings which translated insights and information using Affinity Mapping, clustered the relevant information and synthesised the design challenge at hand.


Phase 2: Insights
Pain points
The research phase led to several key insights, we chose to gather the pain points from our interviews to then affinity map and formulate into points of departure.
These were the three key pain points we identified from our research:
1. Support for busy salesmen
2. Team synergy
3. Time management
'How might we' questions
To create further insights from our research and pain points, we also created How Might We Statements (HMW). These served as the direction for the next ideation sessions.
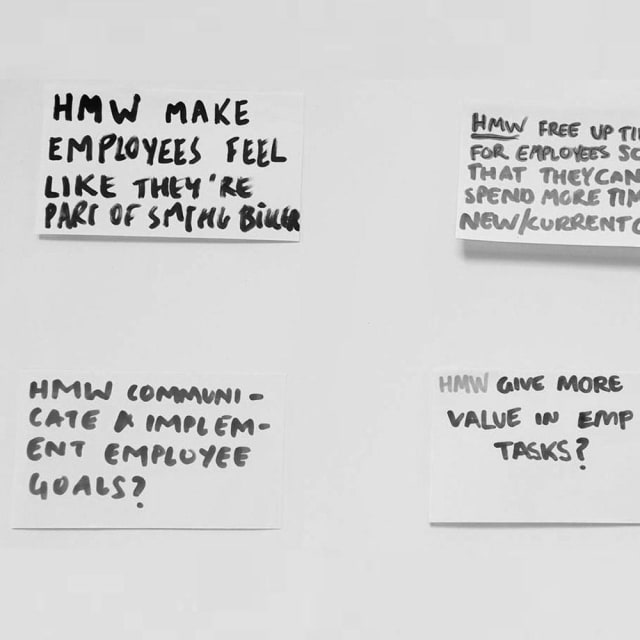
Our key HMW statements were as follows:
1. HMW help employees feel like they're part of the something bigger?
2. HMW communicate and implement employee goals?
3. HMW free-up time for employees so that they can spend more time with new clients?
4. HMW build team synergy?
5. HMW give more value in employee tasks?
6. HMW make customer info accessible to Eigenbrodt employees?
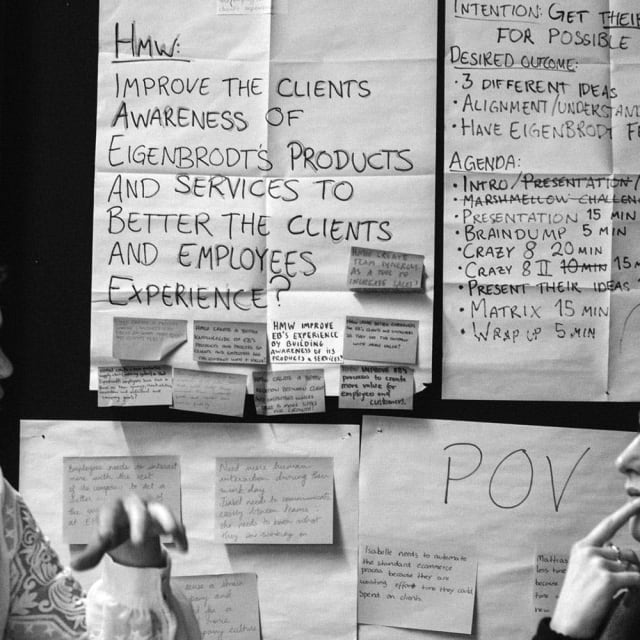
These six statements were then combined to create one all-encompassing statement:
How might we improve the client's awareness of Eigenbrodt's products and services to better the clients and employees experience?


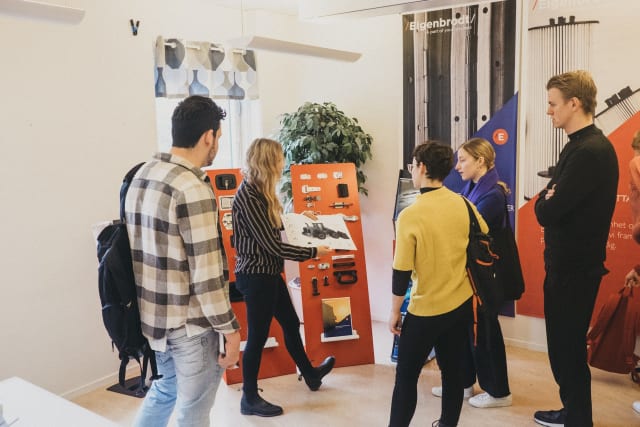
Phase 3: Ideation and workshop
After forming the HMW statement, we involved Eigenbrodt's employees in ideating for a solution around it.
A brainstorming workshop was held with important stakeholders and employees from across the company, we used methods like Crazy 8 and the solution they agreed they needed us to prototype around was:
'A digital sales tool (application) which will support the sales team throughout the whole sales process.'
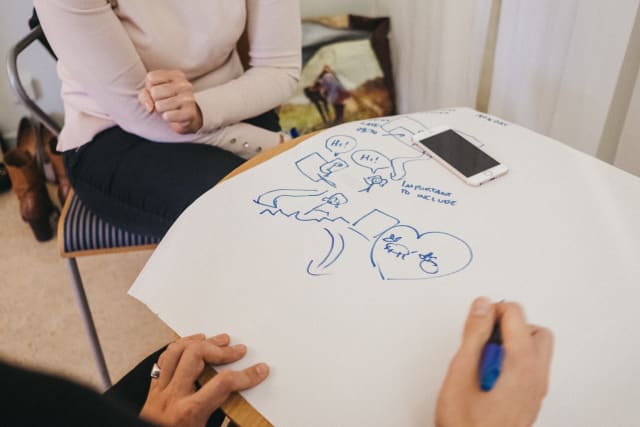
We then invited employees to Hyper Island to ideate using the user journeys created in our research phase. We then used storyboarding to visualise scenarios involving customers and employees, to help ideate around the form the digital sales tool might take.


Phase 4: Prototype
Building upon the direction gained from the workshop and story-boarding in the ideation phase, we created low-fidelity prototypes for a digital tool corresponding to a user journey. We took the cross-market analysis from the research phase for visual inspiration and then took these wireframes, tested them with different sample groups and then iterated upon them, before starting higher-fidelity prototypes in Figma.


Phase 5: Testing and Solution
After user-testing, the final delivery to the client was a concept (high fidelity Figma prototype) of a digital sales tool that provided information about Eigenbrodt's extensive product range, whilst showcasing success stories in a visually compelling way and acting as a multi-purpose tool for the sales team. It would further establish a shared employee vocabulary for the products and indirectly improve team synergy. No more analog catalogues and doubts about the latest products but rather a sophisticated sales tool, improving client interaction and increasing sales.

